When a technical discussion turns to noise, especially with several cascaded components involved, the calculations and terminology should be straightforward, but often they become more cumbersome than necessary. Signal-to-noise ratio (SNR) is another parameter that should be routinely calculated by the designer but that still creates uncertainty. The purpose of this application note is to square-up noise, noise floor, bandwidth and signal-to-noise ratio (SNR) in general, and to compute these parameters for a basic, three-component RF front end. Other application notes in this series dive deeper into the cascading of noise figure (NF), P1dB and IP3.
What is an RF Front-End?
The answer to this question varies depending upon who you ask. In the Wikipedia definition, the RF front end includes “all the circuitry between a receiver’s antenna input up to and including the mixer stage”1. In his book RF Circuit Design, Christopher Bowick defines an RF front end as “everything between the antenna and the digital baseband system”2.
The discussion that follows will focus on the components preceding the mixer.
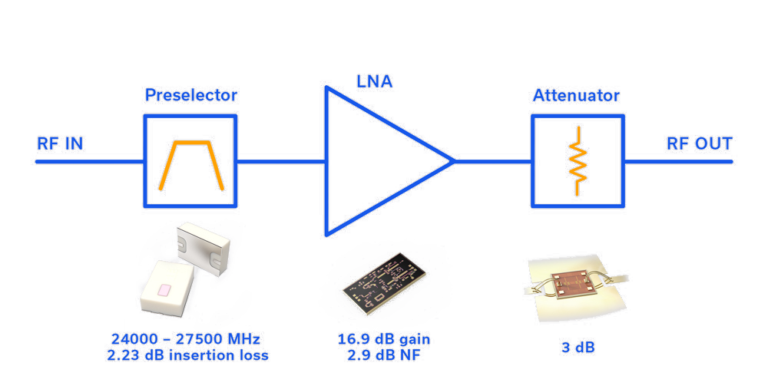
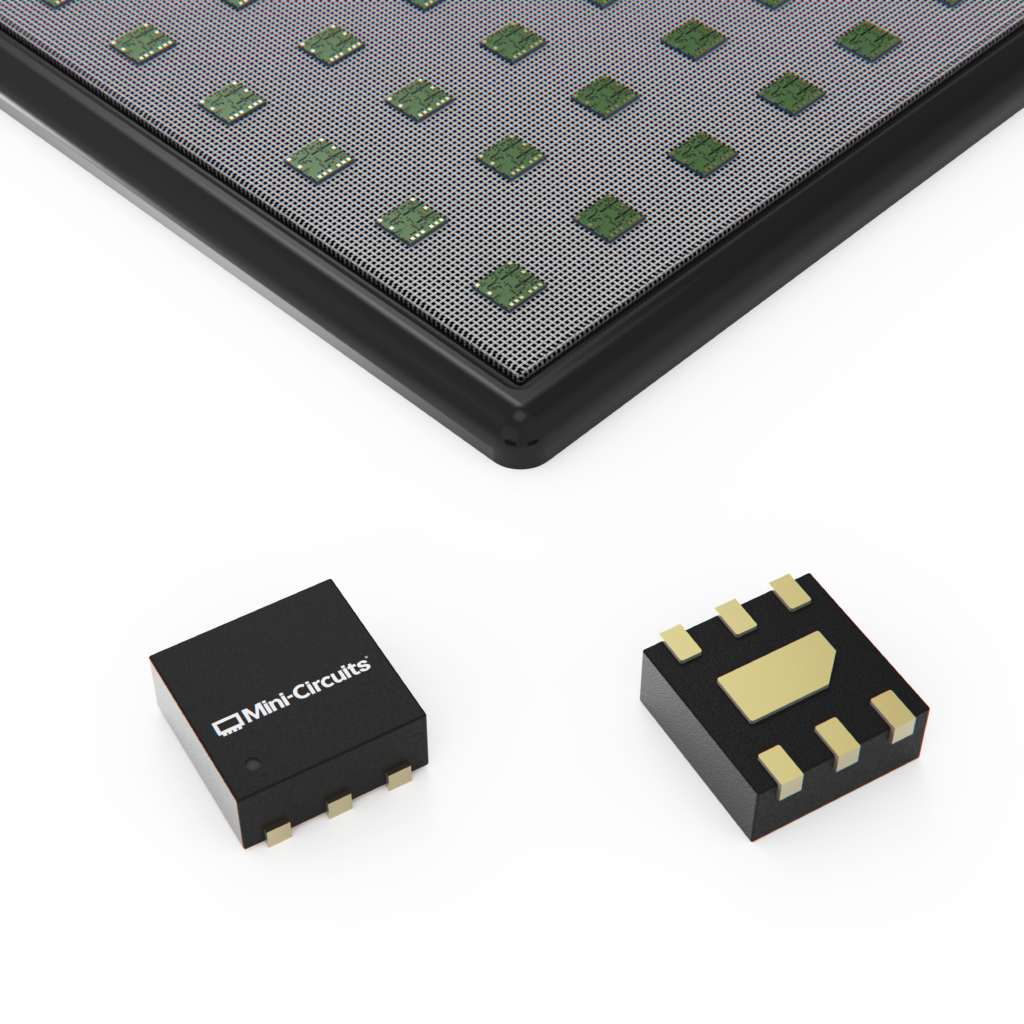
An RF front end capable of covering the 24,000 to 27,500 MHz frequency band is shown in Figure 1. The design includes tiny device case styles that enable the front end to be built on an extremely small footprint. In fact, the three device packages combined occupy less than a total of 20 square millimeters.
One possible application of this cascade would be a point-to-point microwave system covering the 24,250 – 26,500 MHz frequency band. Although the specific components utilized here are far from typical, inserting unique and novel parts into a longstanding application always proves more interesting than a simple discussion of a purely notional block diagram.
The block diagram shows the salient features of the three components, with part numbers listed beneath as links to the data sheets.
- Preselector: Mini-Circuits BFHK-2582+, 24,000 – 27,500 MHz bandpass (2.23 dB insertion loss)
- LNA: Mini-Circuits AVA-0233LN-D(G)+, 16.9 dB gain, 2.9 dB NF
- Attenuator: Mini-Circuits YAT-3A-D(G)+, 3 dB

Noise Levels in the System
To determine the noise levels throughout the system, the place to begin is right at the thermal noise floor, PThermal, which the designer may know as -174 dBm/Hz. Where did that figure come from? The calculation is simply:
P_{\text{Thermal}} = kT_0 BWhere,
k = 1.38 \times 10^{-23} \text{ J/K (Boltzmann's constant)}, \quad T_0 = 290\text{ K nom. per IEEE}, \quad B = \text{Bandwidth (1 Hz)}\begin{aligned} P_{\text{Thermal}} &= (1.38 \times 10^{-23} \text{ J/}\cancel{\text{K}})(290\cancel{\text{K}})(1\text{ Hz}) = 4 \times 10^{-21}\text{ W} = 4 \times 10^{-18}\text{ mW} \\ &\Rightarrow 10\log(4 \times 10^{-18}\text{ mW}) = -174\text{ dBm in a 1 Hz BW, or } -174\text{ dBm/Hz} \end{aligned}Next, we need to determine the system 3 dB bandwidth, in this case defined by the bandwidth of the BFHK-2582+ preselector.
BW_{\text{3dB}} = 27{,}500 - 24{,}000 \text{ MHz} = 3{,}500 \text{ MHz}Our system is clearly not a 1 Hz bandwidth system, so we must calculate the new noise floor.
\begin{aligned} P_{\text{Floor(1)}} &= P_{\text{Thermal}} + 10\log(BW_{\text{3dB}}) \\ &= -174\text{ dBm/Hz} + 10\log(3500 \times 10^{6}\text{ Hz}) \\ &= -174\text{ dBm} + 95.44\text{ dB} = -78.56\text{ dBm} \end{aligned}What is this sorcery? To be exact, one can take the thermal noise floor of the Earth at room temperature (PThermal) and add 10 times the log of the 3 dB bandwidth of the system of interest and arrive at the noise floor of the system.
Consequently, the preselector limits the noise bandwidth to 3,500 MHz, which corresponds to a noise floor of -78.56 dBm. This noise floor will be affected by gain and loss through the system, with one exception: the insertion loss of 2.23 dB in the BFHK-2582+ preselector cannot attenuate the thermal noise floor PThermal below the -174 dBm/Hz level.
Note: This article uses the preselector’s 3 dB bandwidth as an approximation of the equivalent noise bandwidth (ENB). Click here for details.
Strictly speaking, the value used as the noise bandwidth in the calculation above is the filter’s 3 dB bandwidth, but the equivalent noise bandwidth (ENB) Bn should be used for an exact noise power calculation:
B_n = \frac{1}{|H(f_0)|^2} \int_0^{\infty} |H(f)|^2 \, dfIn general, the ENB is not equal to the 3 dB bandwidth. For example, for a single-pole filter:
B_n = \frac{\pi}{2} \times BW_{\text{3dB}}However, the preselector BFHK-2582+ used in this article is an LTCC bandpass filter with steep skirt characteristics, and its passband shape closely approximates a brick-wall response, making the use of the 3 dB bandwidth as an approximation of the ENB entirely reasonable.
If we define a most convenient input signal level, say 0 dBm, we can easily determine the signal-to-noise ratio (SNR) after the preselector in dB as:
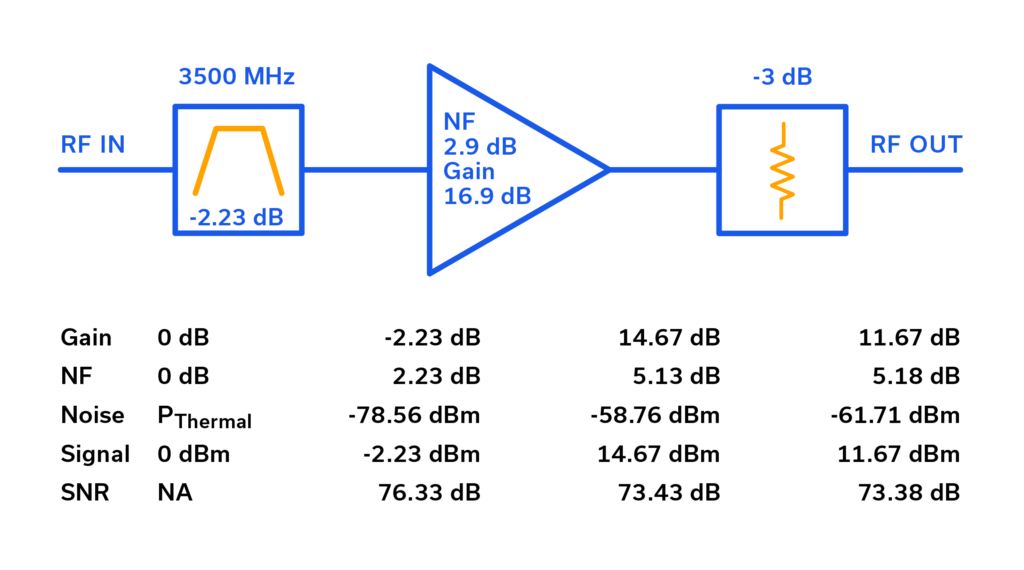
\begin{aligned} \text{SNR (dB)} &= 10\log\!\left(\frac{\text{Signal (mW)}}{\text{Noise (mW)}}\right) \\ &= 10\log(\text{Signal (mW)}) - 10\log(\text{Noise (mW)}) \\ &= \text{Signal (dBm)} - \text{Noise (dBm)} \\ &= -2.23\text{ dBm} - (-78.56\text{ dBm}) = 76.33\text{ dB} \end{aligned}This SNR is shown in Figure 2 after the preselector.
Cascading Gain and Noise Figure
The gain and noise figure of the first stage are simple, they are precisely the insertion loss of the BFHK-2582+ preselector, negative for gain (loss) and positive for NF.
What happens when the AVA-0233LN-D+ amplifier and the 3 dB attenuator are introduced? Examining the parameters that follow the amplifier and the attenuator in Figure 2, proceeding from top to bottom, the gain of the amplifier is simply added to the preceding stage’s gain, as is the loss of the attenuator. The gain is therefore:
\text{Gain} = -2.23\text{ dB} + 16.9\text{ dB} - 3\text{ dB} = 11.67\text{ dB}The noise figure is a bit trickier than gain to cascade through a block diagram and requires that noise figure (NF) in dB be converted to noise factor (F) and run through Friis’ formula for noise factor (F)3. In the case of the first two stages (preselector and amplifier), the noise figure (NF) can simply be added in dB as shown in Figure 2. This is a special property of a passive first stage at the reference temperature T0. For any passive device at T0, the noise factor equals the reciprocal of its gain:
F_{\text{passive}} = \frac{1}{G_{\text{passive}}}Substituting this into Friis’ formula for two stages gives:
F_{\text{Total}} = F_1 + \frac{F_2 - 1}{G_1} = \frac{1}{G_1} + \frac{F_2 - 1}{G_1} = \frac{F_2}{G_1} = F_2 \cdot F_1Because the total noise factor is the product of the individual noise factors, their noise figures (in dB) simply add. Once gain is introduced, and other elements come after that gain in the cascade, we have to account for the effect of gain on noise, which is captured in Friis’ formula shown below:
F_{\text{Total}} = F_1 + \frac{F_2 - 1}{G_1} + \frac{F_3 - 1}{G_1 G_2} + \frac{F_4 - 1}{G_1 G_2 G_3} + \cdots + \frac{F_n - 1}{G_1 G_2 \cdots G_{n-1}}To apply this formula to the third stage (the attenuator), we treat the already-cascaded result of the preselector and amplifier as a single equivalent first stage. In the expressions that follow, F1 and G1 therefore represent the cascaded noise factor and gain of the first two stages combined, while F2 represents the noise factor of the attenuator alone.
Noise factors are determined as follows:
F = 10^{(\text{NF}/10)}so that:
F_1 = 10^{(5.13\text{ dB}/10)} = 3.26, \quad F_2 = 10^{(3\text{ dB}/10)} = 2The gain (G1) is the cascaded gain up to the point where element F2 enters the circuit, and must also be linear:
G_1 = 10^{(14.67\text{ dB}/10)} = 29.31Entering these values into Friis’ equation yields:
F_{\text{Total}} = F_1 + \frac{F_2 - 1}{G_1} = 3.26 + \frac{2 - 1}{29.31} = 3.26 + 0.034 = 3.294Finally,
\text{NF (dB)} = 10\log(F_{\text{Total}}) = 10\log(3.294) = 5.18\text{ dB}Signal Level, Noise Level and SNR
Having already calculated the noise level and SNR after the preselector, we’ll turn our attention towards the effect of the amplifier on those parameters. The amplifier has a gain of 16.9 dB, but the noise level after the amplifier has increased by nearly 20 dB, from -78.56 dBm to -58.76 dBm. The reason for this is that the NF of the amplifier also adds noise (in dB), so it, too, increases the level of the noise floor. It is important to utilize cascaded gain and NF parameters when calculating noise and SNR. After the amplifier, the cascaded gain is 14.67 dB and the NF is 5.13 dB, for a net sum effect on the noise floor of (14.67 dB + 5.13 dB) = 19.8 dB. Therefore the new noise floor level and SNR are calculated as:
\begin{aligned} P_{\text{Floor(2)}} &= P_{\text{Floor(1)}} + G + \text{NF} = -78.56\text{ dBm} + 19.8\text{ dB} = -58.76\text{ dBm} \\[6pt] \text{and} \quad \text{SNR} &= 14.67\text{ dBm} - (-58.76\text{ dBm}) = 73.43\text{ dB} \end{aligned}Including the final component, the 3 dB attenuator, might appear to be easy, but this is where we start to delve into pure cascade analysis. Recall that we had to use Friis’ formula to calculate the NF once including this third stage. Using the previously-calculated NF we have:
\begin{aligned} P_{\text{Floor(3)}} &= P_{\text{Floor(1)}} + G + \text{NF} = -78.56\text{ dBm} + 11.67\text{ dB} + 5.18\text{ dB} = -61.71\text{ dBm} \\[6pt] \text{and} \quad \text{SNR} &= 11.67\text{ dBm} - (-61.71\text{ dBm}) = 73.38\text{ dB} \end{aligned}Summary
In this application note, we’ve provided a brief explanation showing calculations for the thermal noise floor, noise floor at a given 3 dB bandwidth and the signal-to-noise ratio (SNR) at each stage along a 3-stage RF front end. Friis’ formula was used to the extent necessary for cascading NF. Signal level was simplified by starting at 0 dBm, and computation of noise level and SNR were performed using cascaded gain and NF values.
In Part 2 of this series, “Calculating Noise and Signal-to-Noise Ratio (SNR) in a 26 GHz 5G Front-End,” we examine a more practical six-stage RF front-end — targeting the 24.25–25.1 GHz portion of the 5G n258 band — that adds a mixer, IF filter, and IF amplifier, and we take a closer look at cascaded analysis when a frequency-conversion stage is involved, as well as how the change in system bandwidth introduced by the IF filter affects the noise floor.
Products Used in This App Note
References
- RF Front End, Wikipedia
- “What’s in an RF Front End?” EE Times, February 4, 2008, excerpted from Chapter 8 of a new edition of the book RF Circuit Design, 2e by Christopher Bowick.
- H.T. Friis, “Noise Figures of Radio Receivers,” Proc. IRE, vol. 32, no. 7, pp. 419–422, July 1944.